Loyalty Launch Guide
How to Launch a Customer Loyalty Program in 6 Easy Steps.
I extracted 2,406 post records from GrowthHackers.com and analyzed them posts to gain some additional insight about the ecosystem. This is that insight.
We've been fans and members of the GrowthHackers.com community since the very early days. One of the principle objectives of growth hackers is to increase the virality of their products through word of mouth marketing and referral programs. We're focused on providing tools that growth hackers need to achieve this objective. It was in this spirit that we wanted to provide this analysis to the community.
On Jul 21, 2014 at 5:58 PM, I extracted 2,406 front-page post records from GrowthHackers.com. I then analyzed those posts to gain some additional insight about the ecosystem. This is that insight.
For this first analysis I only extracted front page posts, posts that received at least four votes, or were posted prior to March 1. It was in March that the GrowthHackers team upgraded the ecosystem, causing only posts recieving four or more votes to appear on the front page. This means there is some discrepancies in the data that I will attempt to mend in a future, more thorough, crawl.
Basic Stats:

The most popular two categories by a landslide are "Growth Hacks" and "Optimization." Between these two categories they account for over 33 percent of all GrowthHackers.com posts.
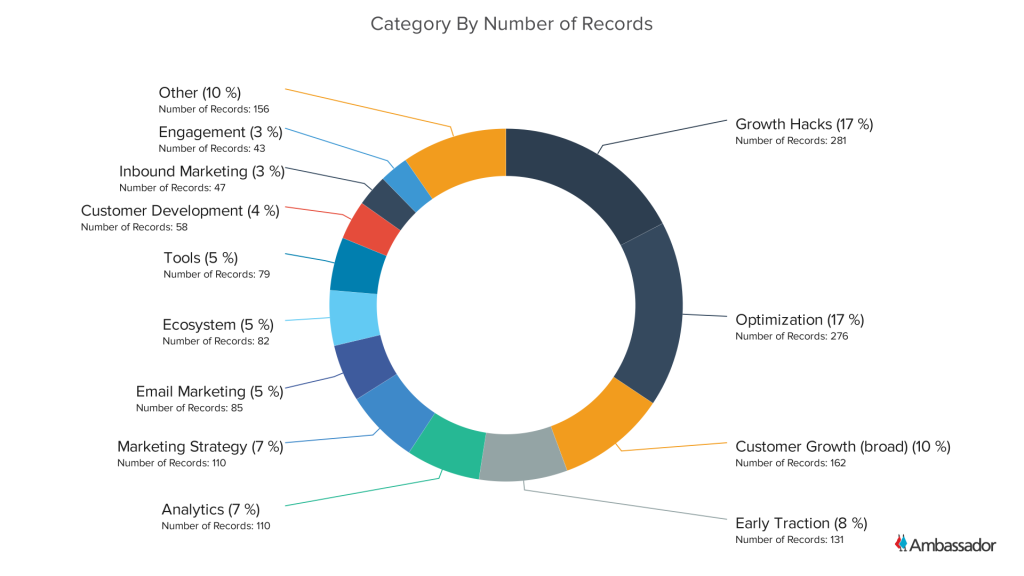
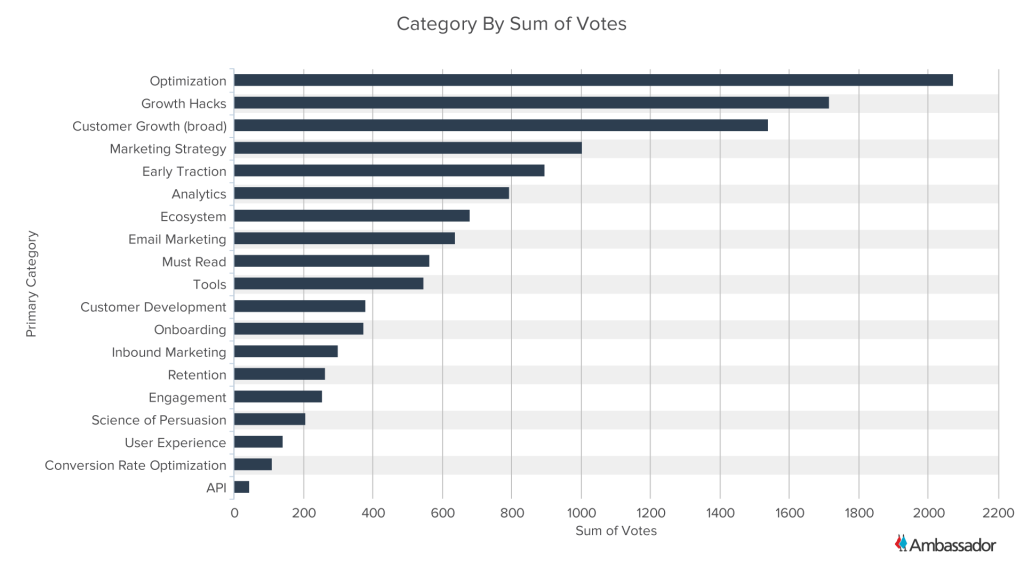
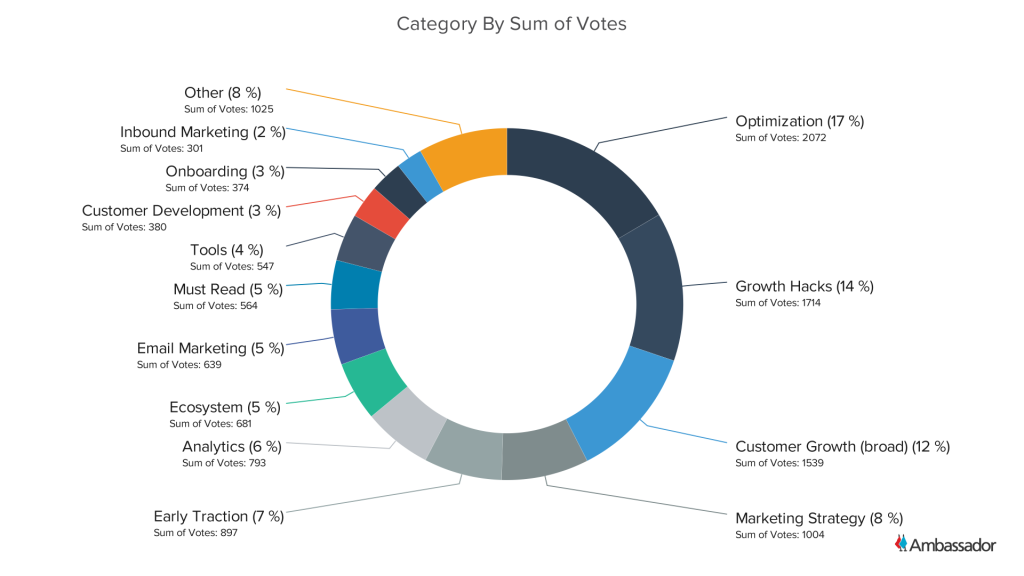
The high volume of posts for these two categories account for the correspondingly high proportion of the aggregate share of votes and comments. A lower portion of "Customer Growth (broad)" posts accounts for a larger portion of the sum of votes.
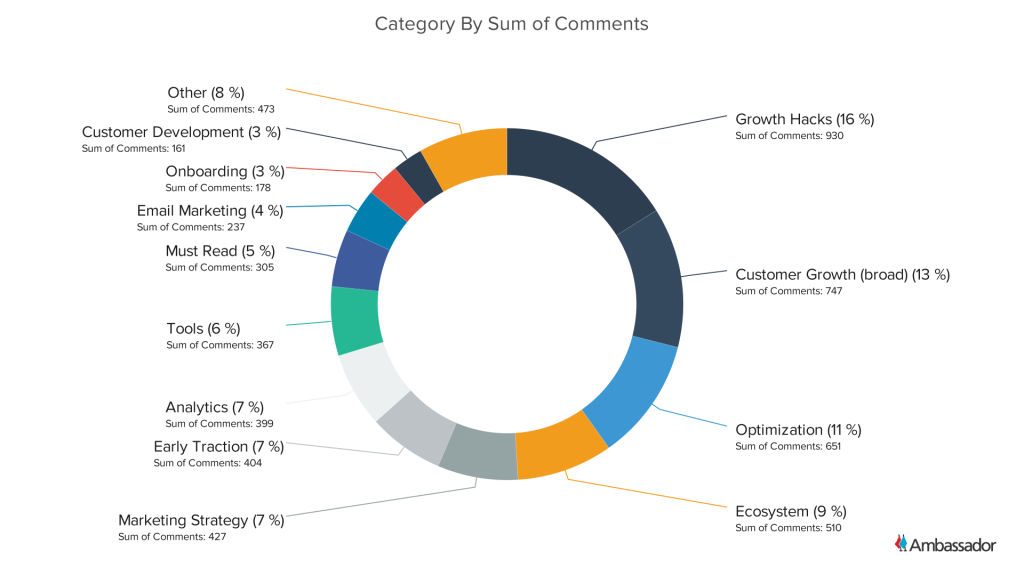
This jump is even more evident when we begin to look at the sum of all the comments. The "Customer Growth (broad)" category jumps up to the number two spot. "Customer Growth (broad)" generates 13 percent of the total number of comments, despite accounting for only 10 percent of the total number of posts.
The "Must Read" category generates the highest average vote count per post. This makes sense, since the "Must Read" category is the only category on the blog that earns its own spot in the left-hand menubar. The "Customer Growth (broad)" category earns the fourth highest average amount of votes per post. "Growth Hacks" and "Optimization" both dropped positions dramatically. This also makes sense, since the high volume of posts dilutes the average quality per post as measured by votes.
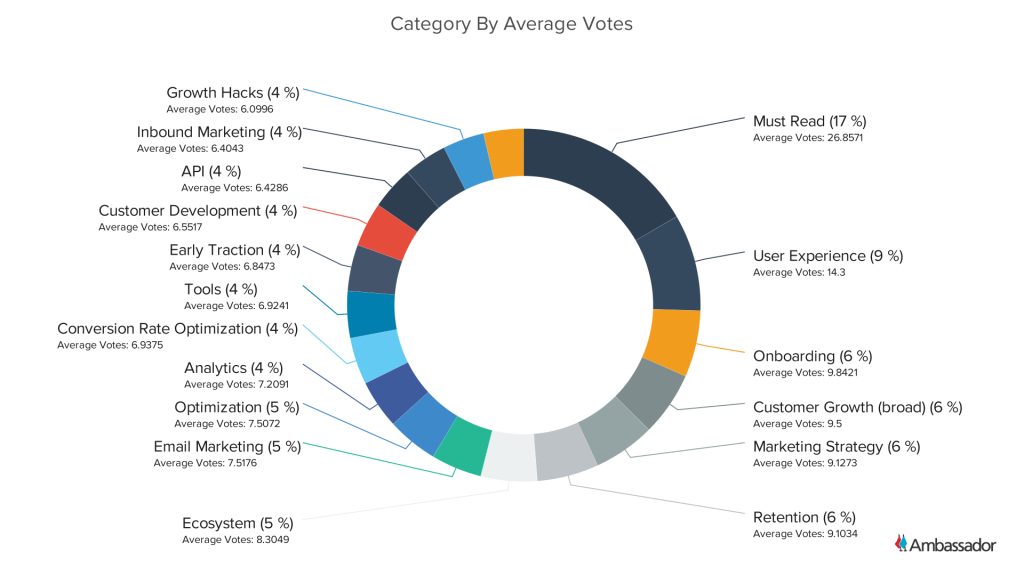
The "Must Read" category is the most discussed post category, generating an more than 14 comments per post on average as Optimization continues to fall. This isn't suprising since the "Must Read" category gets it's own link in the left-hand navigation of the site. "Ecosystem" rises to the most discussed non-menu category, most likely due to the opinionated and abstract nature of the category itself.

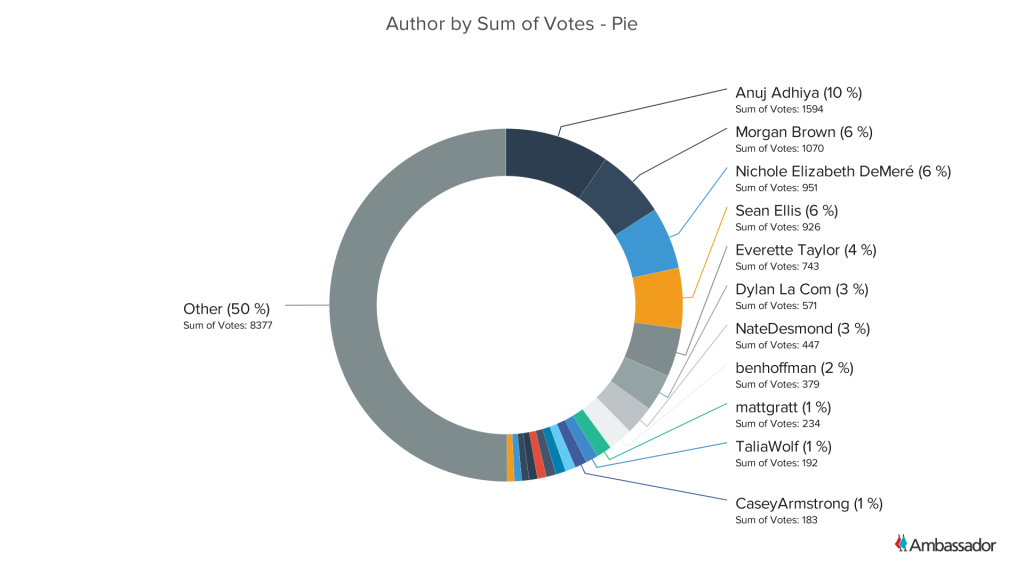
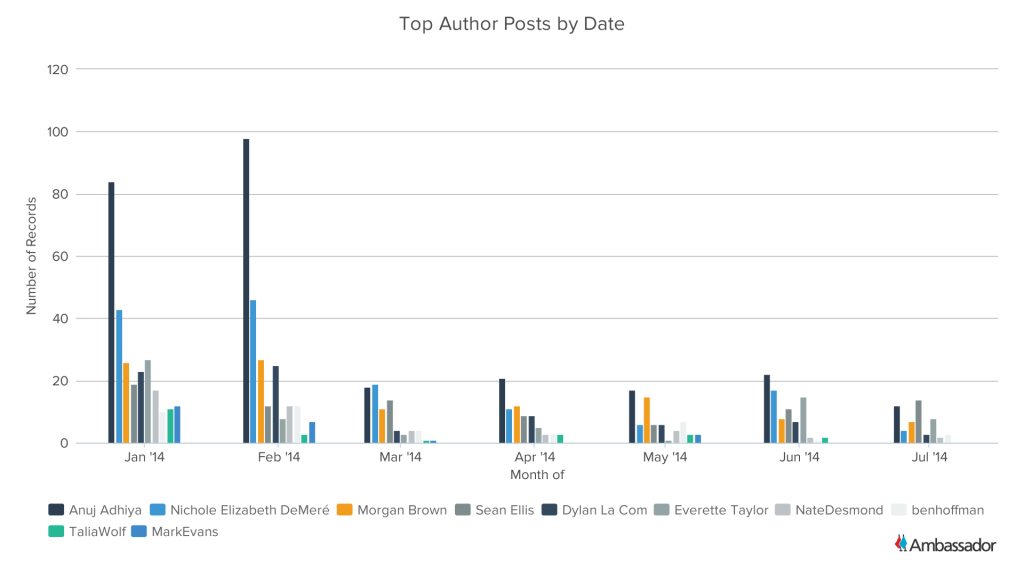
The majority of the heavy lifting is done by a minority of the population. Growth Hackers take note; this is probably true of your customers as well (more on the Pareto principle). 63% of the GrowthHackers.com posts from Jan 5 to July 21 came from just 11 authors representing just 1.6% of the users that submitted posts that made it to the front page (650).
The largest aggregate number of votes and comments belongs to a small group of power users. The top 11 users earned 50 percent of all the votes dished out on GrowthHackers.com. The same group dominates the conversation, receiving 49 percent of all the comments on the site.
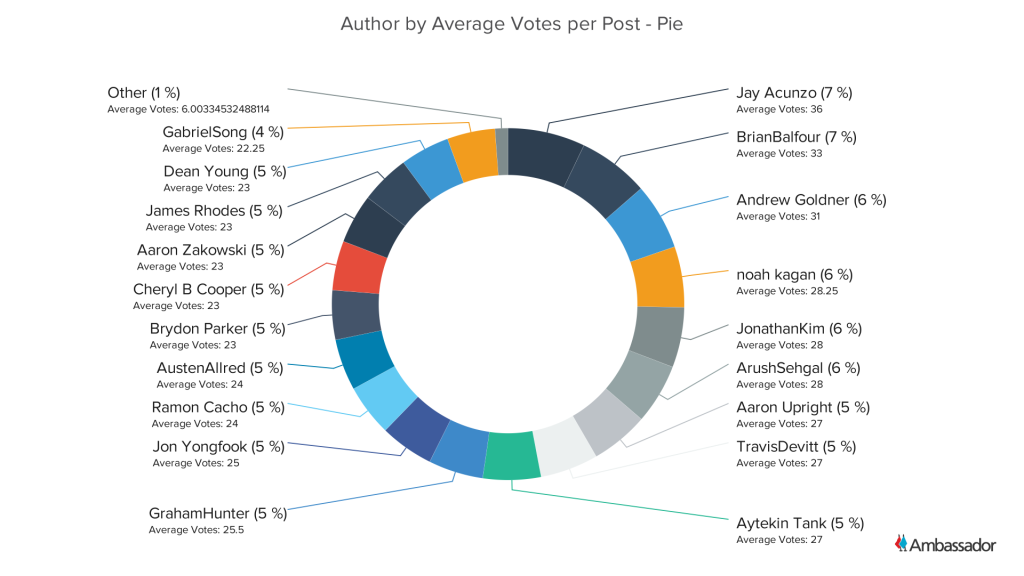
But quantity = quality. Ramon Cacho appears to be generating the highest number of votes per post, although he only posted one very popular post (http://growthhackers.com/facebook-ads-bidding-101-everything-you-need-to-know-supported-by-data/). Both KC and Charlie have posted at least two times, and Conrad has posted five times, making his high average even more impressive (but what would you expect from the founder of GrowHack).
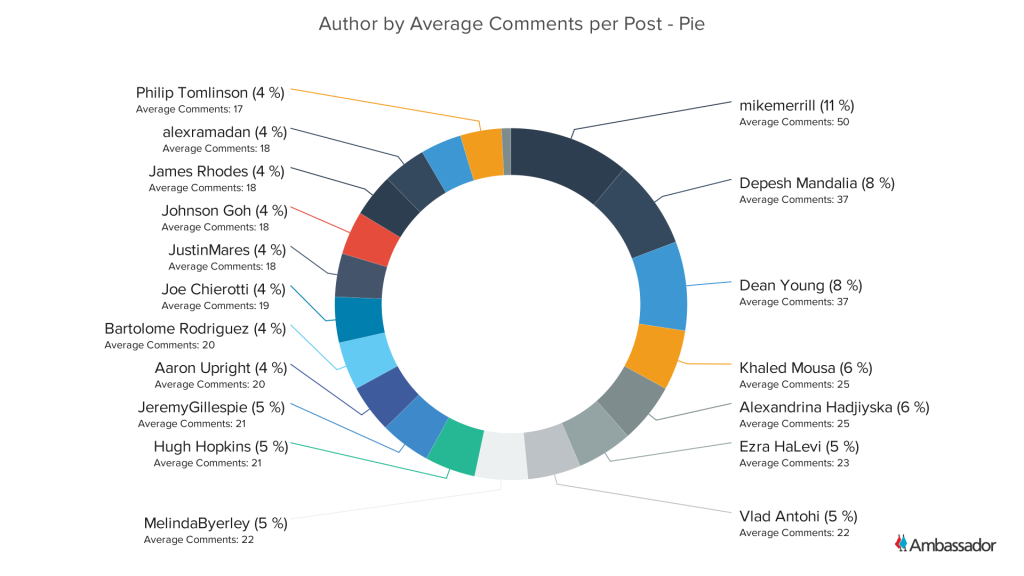
The most contentious author award belongs to Ezra HaLevi, who is averaging 23 comments per post accross 3 front-page posts. It's worth noting that Ezra has submitted five posts total. Two posts didn't make it to the front page. It seems that when they do, they cause quite the discussion.
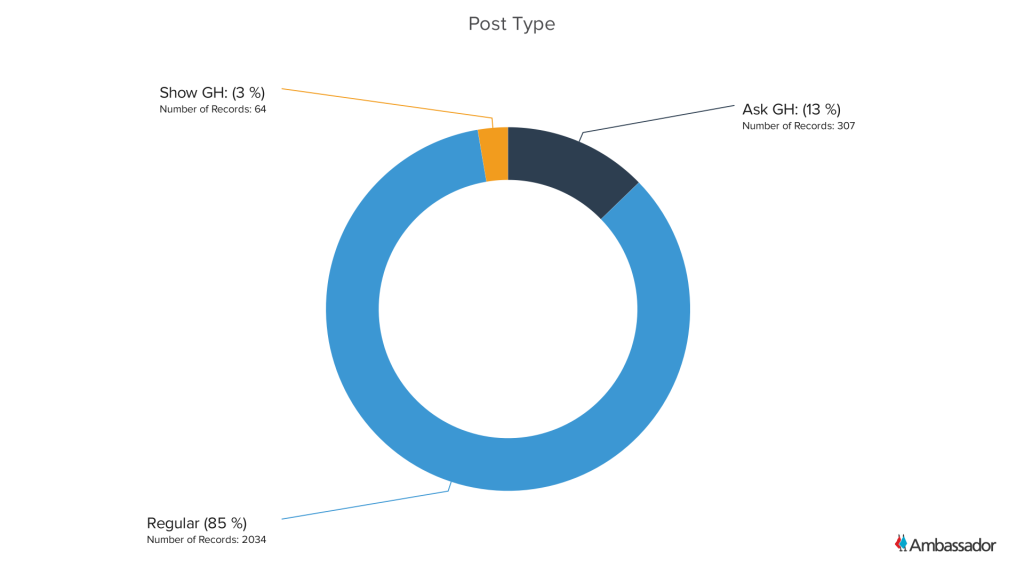
There are three primary types of posts on GrowthHackers. "Ask GH:," "Show GH:," and regular posts. "Ask GH:" is where the user posts a question to the community. These posts generally don't link to an external site, but instead maintain the discussion inside of the GrowthHackers.com ecosystem. "Show GH:" posts are when the user shares something with the community, usually slides or a video. These posts are also typically hosted inside of the GrowthHackers ecosystem. Finally there are regular posts, which link out to an external article.
Since I just used some simple regex on the title, these posts could be skewed if a user decides to include the string "Show GH:" in their regular post title. Next time I'll perform regex on the post URL to see if I can extract more detailed information.
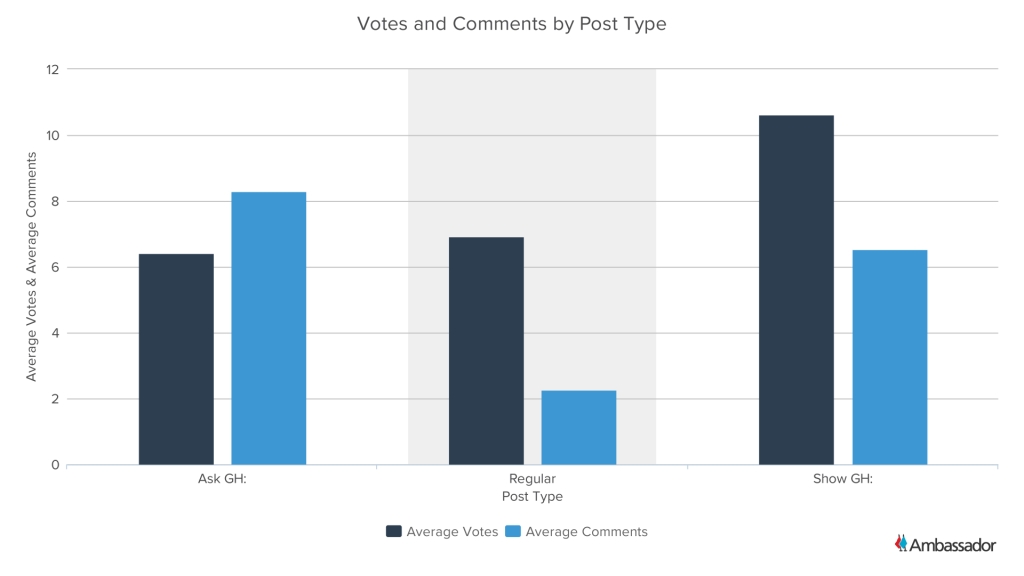
But how does each post type do?
The GrowthHackers community is quite supportive and loves to give each other praise on their accomplishments. "Show GH:" garnished the highest average votes per post. Not surprisingly, "Ask GH:" posts generated the most discussion.
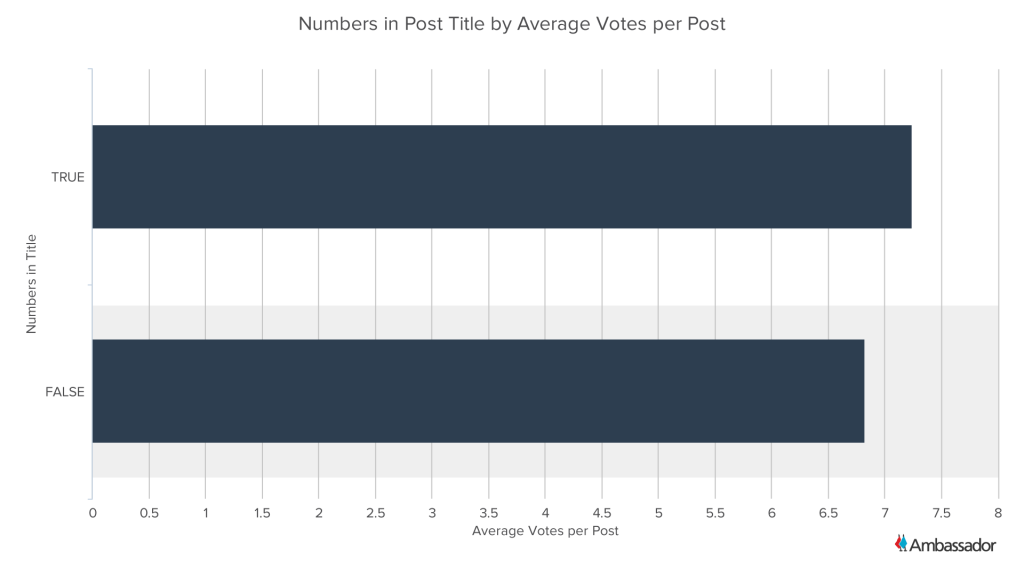
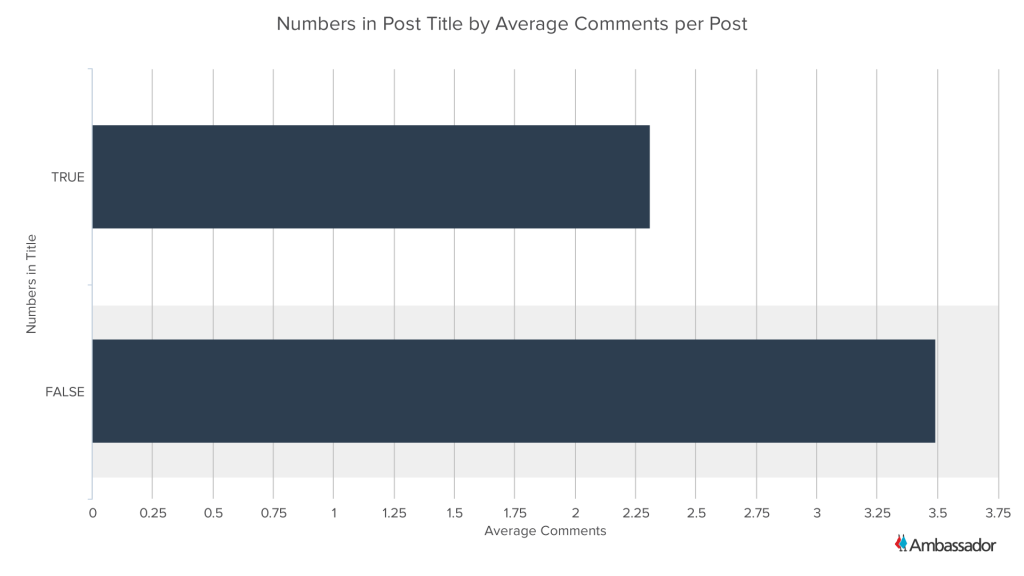
Numbers in post title increased the average vote count by a small amount, but significantly underperformed posts without numbers in the title at generating discussion.
I performed the same analysis for posts with the word "slide" (caps agnostic) in the title. Both comments and votes improved when the post title indicated that the post contained slides. Including the string "video" in the title had a less dramatic effect, and actually decreased the average votes per post. 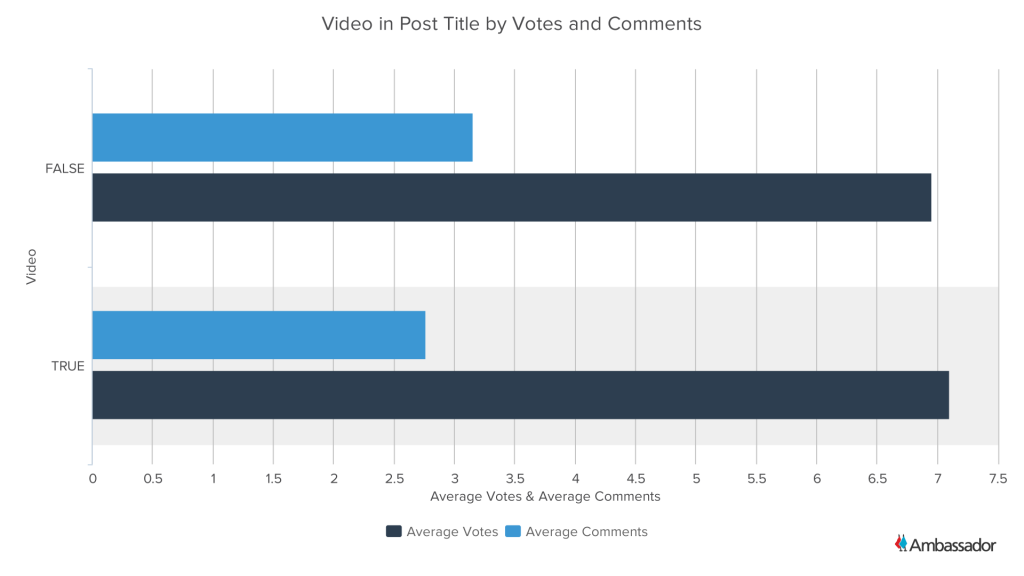
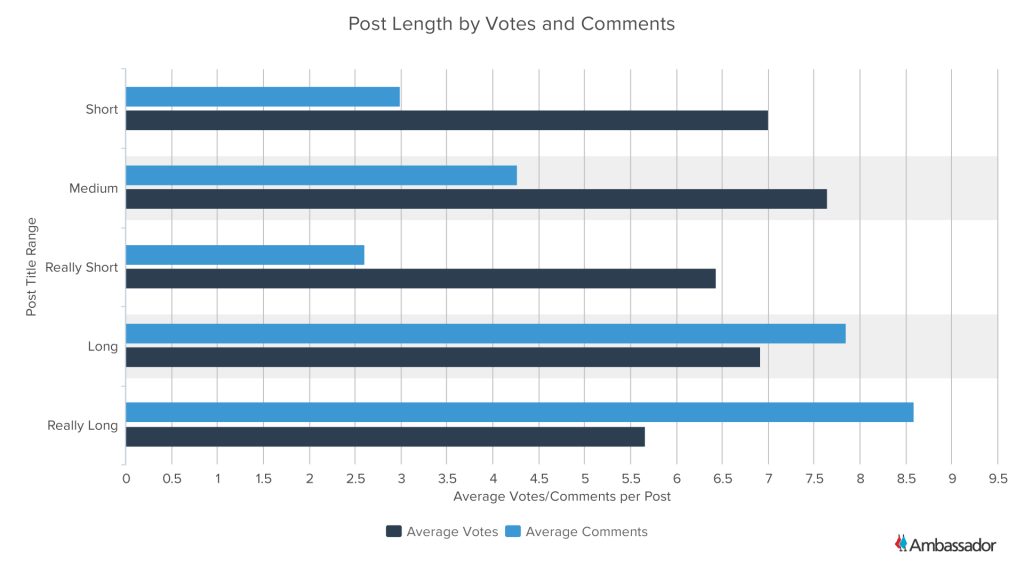
I took a quick look at whether or not the length of the post title had any effect on the community's reaction. Post title length formed a pretty bell curve, predictably skewing out towards longer post titles (you can't have a negative post title length).
I segmented each post into either "Really Short" (0-50 characters), "Short" (51-100), "Medium" (101-150), "Long" (151-200), and "Really Long" (201+). My conclusion was that there was a varied effect on post comments, but "Medium" and "Short" post title lengths seemed to perform the best in terms of average votes per post.
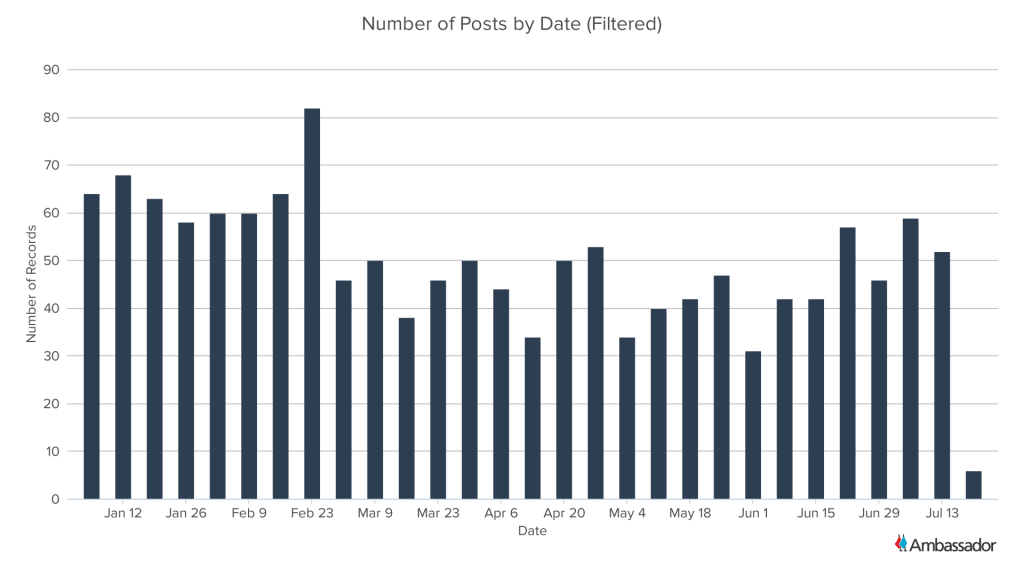
One of the interesting things I discovered when doing my date analysis was what appeared to be a major drop in the number of first page posts. After closer examination I was able to determine that there was a change in the criteria that qualified a post to be displayed on the front page. After March 1, GrowthHackers.com required that a post accumulate at least four votes to qualify it for front page. Prior to that posts with only one vote were able to appear on the front page.
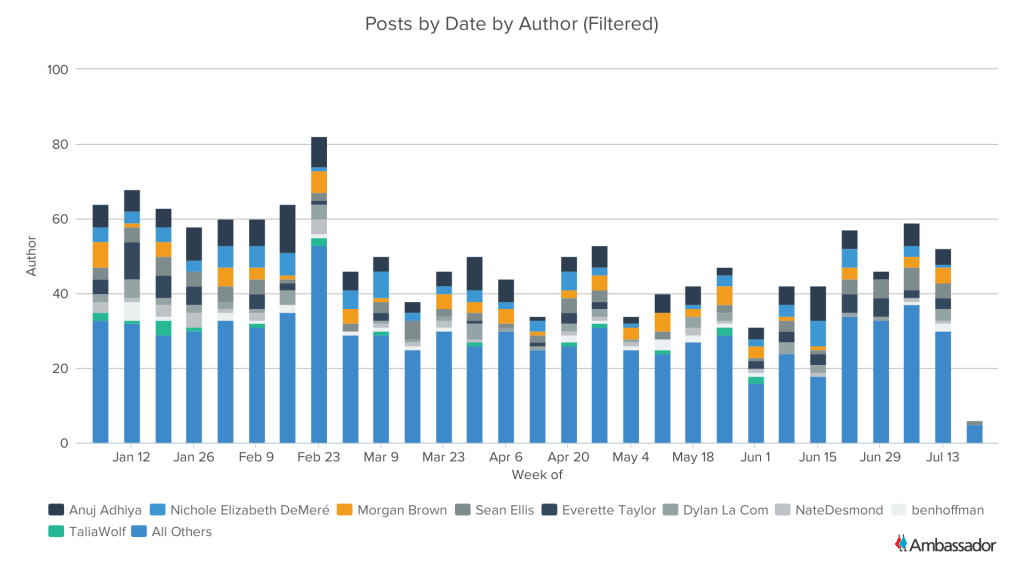
I was interested in how the activity and discussion of non-authors was growing over time. If you look closely at the cumulative graph, it's very difficult to tell if the new criteria for front page posts had any effect on the derivative of the sum of the votes/comments.
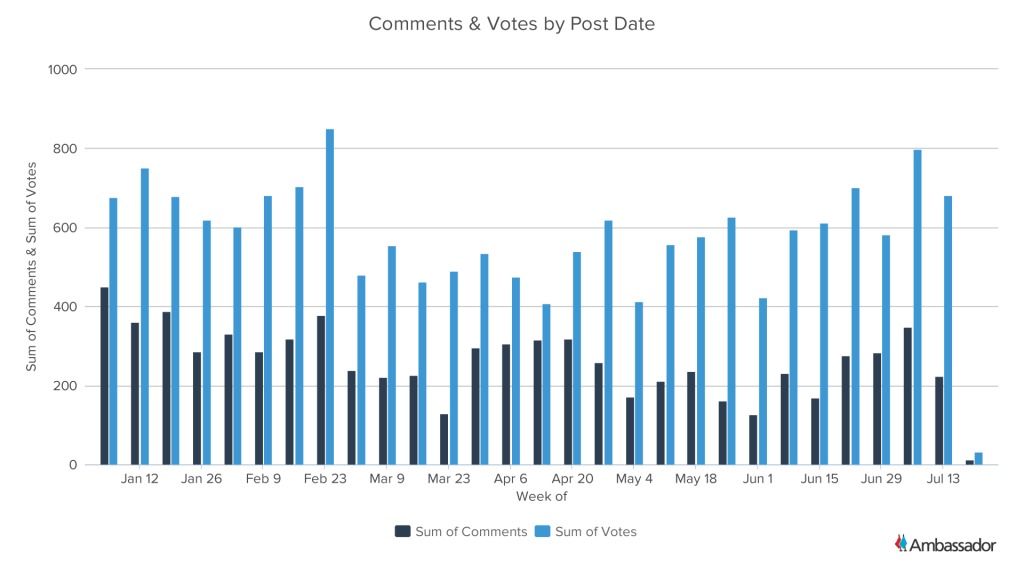
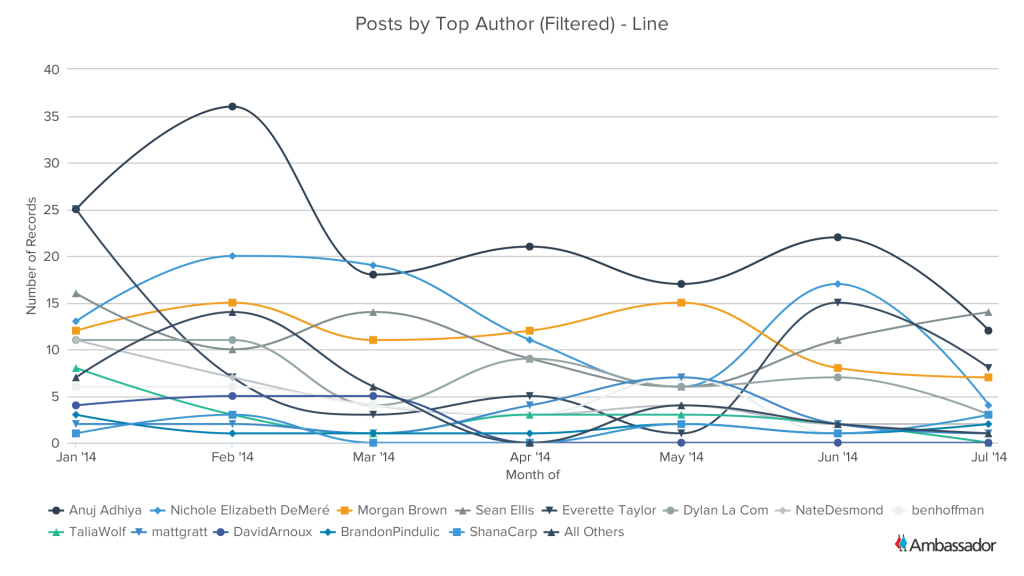
Filtering out the posts that only have four votes or more we can see that it does diversify the author submissions, but not too dramatically. 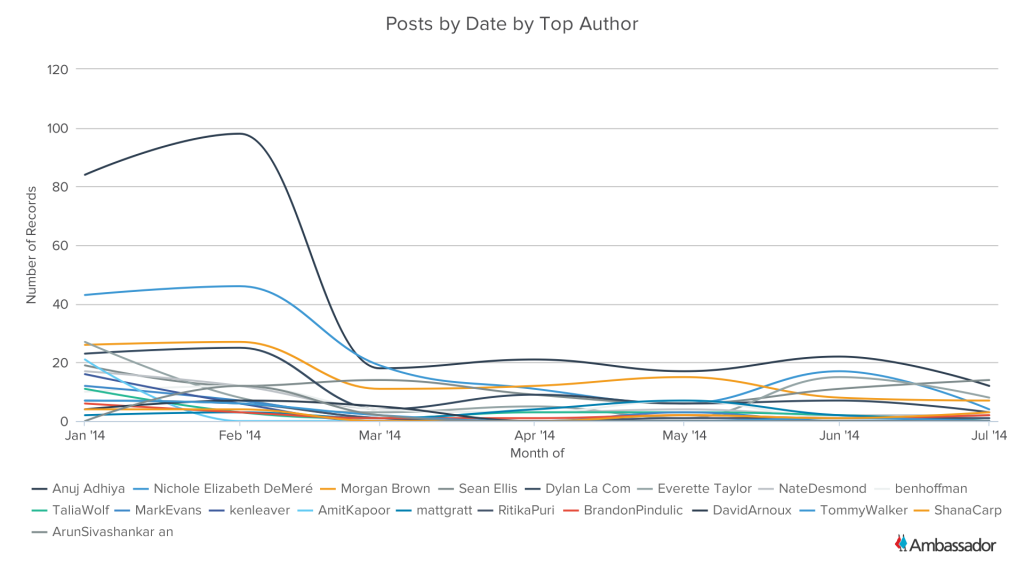
I used three primary tools to create this analysis; the Kimono web crawler, Google Sheets for some data manipulation, and DataHero to produce the graphs and charts.
Kimono made the process of extracting structured information from the site relatively easily. With the Kimono Labs chrome plugin installed I was able to create an API in one click.
This enabled me to crawl the front-page posts. In order to gather data beyond the first page, I attempted to use Kimono's pagination feature. I quickly discovered that the GrowthHackers "next page" link disappeared around page six, so I switched to Kimono's manual targeting feature. I used a scratch sheet in Google Sheets to quickly concatenate the URL structure to create links for all 272 pages. Pasting them into Kimono's targeted crawling detail page made the process easy.
From there it was just a matter of getting the targeting just right, and downloading a CSV of the information.
I imported the CSV to Google Sheets to perform a little bit of data manipulation, like categorizing the post-title lengths into five categories "Really Short," "Short," etc... I also used Sheets' "REGEXMATCH()" function to determine if the post title contained "Ask GH:," "Show GH:" etc... Finally I used the "REGEXEXTRACT()" function to extract the post date from the byline and convert into a "VALUE()" that Sheets prefered to work with.
After that it was just a matter of visualizing the most interesting information with DataHero.
Do you want to learn how to turn more of your customers, partners, affiliates, and fans into revenue generators?Request a custom demo from one of our referral marketing software experts today!

Ambassador partnered with Nielsen’s Harris Poll Online to get insight about today's referral practices. Read on to see what we discovered.
Maximize your financial services growth with an effective referral program. Get insights into transparency, rewards, and program optimization.
The guide to a successful channel partner program with expert insights. Learn how to manage partnerships effectively and drive revenue.
Sign up for our Ambassador newsletter and get notified when we publish new
eBooks, case studies, blog posts and more. It's like a crash course in referral
marketing - and it's free. Plus, we promise not to spam you.